What Is FSN Analysis?
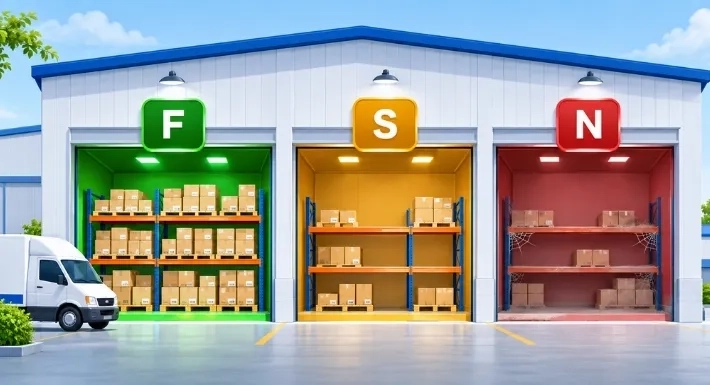
FSN analysis is an inventory classification method that sorts products into three groups: Fast-moving (F), Slow-moving (S), and Non-moving (N), based on how often and how recently they sell.
The goal is simple. Know which products drive cash, which ones are slowing down, and which ones are tying up money on your shelves.
For distributors and wholesalers, this matters because inventory is both your main source of revenue and one of your largest costs. Stock that does not sell still takes up space, needs handling, and holds cash you could use to buy products that do sell.
Why Slow and Non-Moving Stock Costs More Than You Think
Unsold stock does not just sit quietly. It adds up in several ways:
- Holding costs: Storage, handling, insurance, shrinkage, and the cost of tied-up capital. Many sources estimate carrying costs at 20–30% of inventory value per year, but the real figure varies by business. Calculate your own rate.
- Cash flow pressure: Money locked in stagnant products cannot fund fast sellers, which can lead to stockouts and lost sales.
- Margin loss: Items that finally need heavy discounts or disposal reduce your margin later.
- Write-downs: Stock that loses value may need to be written down, which reduces reported profit.
Is Your Stock Moving? A Simple Way to Check
The table below shows sample thresholds. They are examples, not rules. Set your own based on your products and how fast they sell.
|
Category |
What it means |
Sample rule (adjust for your business) |
|
Fast-moving (F) |
Sells often and recently |
Last sale within 30 days and 6 or more sales in the last 90 days |
|
Slow-moving (S) |
Sells, but not often |
Sold in the last 90 days, but does not meet the Fast rule |
|
Non-moving (N) |
No recent demand |
No sale in the last 90 days (and the item is older than 90 days) |
Why use two measures? A single “days since last sale” rule can mislead. A product that sold one unit yesterday would look “Fast” even if it sells once a quarter. Combining recency with sales frequency gives a truer picture.
How to Do FSN Analysis: Step by Step
Step 1: Pick your time period
Use 90 days as a starting point. Use a longer period for products that sell less often.
Step 2: Count only real demand
Use customer sales only. Do not count warehouse transfers, van loading, or internal stock moves. These move stock from one place to another, but they are not in demand. Counting them can hide dead stock.
Step 3: Calculate days since last sale
Days Since Last Sale = Today’s Date − Date of Last Sale
Step 4: Count sales in the period
Count how many sales transactions each item had in the last 90 days.
Step 5: Apply your rules
Compare each item to your Fast, Slow, and Non-moving rules.
Step 6: Exclude new products
Give new items a grace period, such as 90 days after first receipt. Otherwise, a product launched last month looks dead before it has had a chance to sell.
Step 7: Calculate trapped capital
Trapped Capital = Non-Moving Stock on Hand × Unit Cost
Use your landed cost or inventory valuation cost, so the figure matches your books.
Worked Example
These numbers are illustrative only.
|
Product |
Days since last sale |
Sales in last 90 days |
Stock on hand |
Unit cost |
Class |
|
Cola 500 ml |
2 |
48 |
600 |
$0.40 |
Fast |
|
Orange juice 1 L |
12 |
2 |
250 |
$1.10 |
Slow |
|
Mango drink 250 ml |
45 |
3 |
300 |
$0.35 |
Slow |
|
Lemon soda 330 ml |
120 |
0 |
400 |
$0.55 |
Non-moving |
|
Ginger ale 330 ml |
200 |
0 |
150 |
$0.80 |
Non-moving |
Trapped capital: (400 × $0.55) + (150 × $0.80) = $220 + $120 = $340
If your carrying cost is 20% per year (an assumed rate for this example), holding that stock costs about $68 a year, before any write-down.
Notice the orange juice. It sold 12 days ago, but only twice in 90 days. A recency-only rule would call it “Fast.” Using both measures correctly marks it “Slow.”
FSN vs. ABC Analysis
The two methods answer different questions.
|
FSN analysis |
ABC analysis |
|
|
Based on |
Movement speed and recency |
Value of annual consumption |
|
Question it answers |
“What is selling, and what is stuck?” |
“Which items matter most by value?” |
|
Cutoffs |
Set by you |
Often around 80/15/5, but they vary |
Use them together. A simple FSN-ABC view helps you decide where to act first:
- High value + Non-moving: Act immediately. This is where the most cash is trapped.
- High value + Fast: Protect with tight reorder points.
- Low value + Non-moving: Clear out when convenient.
What to Do With Each Category
Fast-moving: Protect your revenue
- Set reorder points based on supplier lead times.
- Keep a buffer so you do not run out.
- Negotiate volume pricing or rebates with suppliers.
- Make sure vans and routes carry enough of these items.
Slow-moving: Act before it gets worse
- Check your minimum order quantities (MOQs). Slow stock often comes from ordering large quantities to meet a supplier’s minimum.
- Bundle with fast sellers. Pair a slow item with a top seller at a small discount.
- Give sales reps a reason to push it. A targeted incentive for placing slow stock with retailers can help.
- Offer a modest promotion. A small, time-limited discount (for example, 5–10%) while the product is still in good condition. Test the discount level, since the right amount varies.
Non-moving: Recover cash
- Stop reordering. Pause open purchase orders for these items.
- Ask your supplier. Check return or buyback terms. Returning stock for credit is often the quickest way to recover cash.
- Move it in bulk. Offer clearance deals to secondary wholesalers or institutional buyers, even at break-even or a small loss.
- Write it off if needed. If stock is expired or obsolete, it may need to be written down or disposed of.
Accounting note: How you record write-downs depends on your accounting standards (such as IFRS or US GAAP) and local rules. Tax treatment also varies by country. Confirm with your accountant before writing off stock.
FSN Analysis for Van Sales and Route-Based Distribution
If you sell through vans and routes, one overall FSN report can hide problems.
- A product can be “Slow” at your main warehouse and “Non-moving” on a remote route. Run the analysis by warehouse and by route.
- Rebalance before reordering. Move stock from where it is stuck to where it sells, instead of placing a new purchase order.
- Watch van stock. Items that keep riding in vans without selling look busy because they are loaded daily, but they are not creating revenue. This is why internal moves should not count as demand.
For more on tracking stock from receipt to delivery, including van stock, returns, and batch expiry, read our guide to inventory management for distributors. To see how AI supports demand forecasting and van stock control, see how AI improves van sales and distribution management.
Combine FSN With Profit
Speed is not the only measure. A slow product with a high margin may still be worth stocking. A slow product with a thin margin may cost you more than it earns.
Compare your FSN results with profit by item and inventory valuation reports before deciding what to discount or drop.
Handle Seasonal Products Carefully
Seasonal items can look “Non-moving” in the off-season, then sell fast at peak time. Compare against the same period last year before marking them for clearance.
How Often Should You Run FSN Analysis?
|
Frequency |
Who reviews |
Focus |
|
Weekly |
Operations and warehouse |
Stockout risk on fast movers |
|
Monthly |
Sales and finance |
Slow movers, bundles, and promotions |
|
Quarterly |
Senior management |
Non-moving stock value and clearance decisions |
Limits of FSN Analysis
- It does not show profit, so pair it with margin data.
- Results depend on the thresholds you choose.
- It looks backward. New products and seasonal items need special handling.
- Data quality matters. Wrong stock counts or sales entries give wrong results.
Frequently Asked Questions
1. What is FSN analysis in inventory management?
FSN analysis classifies stock as fast-moving, slow-moving, or non-moving based on how often and how recently each item sells. It helps you decide what to reorder, promote, or clear.
2. How do you calculate FSN analysis?
Find the days since each item’s last sale and count its sales in a set period, such as 90 days. Compare both to your thresholds, then calculate trapped capital for non-moving items using stock on hand × unit cost.
3. What are good threshold days for FSN analysis?
There is no single standard. A common starting point is 30 days for fast, up to 90 days for slow, and more than 90 days for non-moving. Set longer periods for slow-selling or seasonal products.
4. What is the difference between FSN and ABC analysis?
FSN looks at how fast items move. ABC looks at how much value they represent. Use both together to decide where to act first.
5. What is the difference between slow-moving, non-moving, and dead stock?
Slow-moving items still sell, but not often. Non-moving items show no recent sales. Dead stock usually means non-moving items that are unlikely to sell again at a normal price.
6. How do you reduce non-moving inventory?
Stop reordering, ask suppliers about returns, bundle or discount stock, offer it to clearance buyers, and write it off if it is expired or obsolete.
7. How often should you run FSN analysis?
Weekly for fast movers, monthly for slow movers, and quarterly for non-moving stock. Run it by warehouse or route if you sell through vans.
8. Can you do FSN analysis in Excel?
Yes. List each item with its last sale date, sales count, stock on hand, and unit cost. Then add formulas for days since last sale, classification, and trapped capital.
Know What Is Selling and What Is Stuck
FSN analysis gives you a clear view of which products earn their shelf space and which ones hold your cash. Start with one warehouse or route, use sales-only data, and review it on a regular schedule.
If you manage field sales and distribution, SalesRoute.ai helps you track inventory, orders, and sales performance in one place. Try SalesRoute.ai free and see how it fits your operation.